(
Image 1)The display on the left is visible on almost every map of this website. The current average global temperature is calculated from averaging the temperatures of approx. 130 weather stations. The data for this are from
http://weather.noaa.gov/.
The
Climate Change Index (+1.6° Celsius) is calculated from the deviation of the longterm average temperature of the 130 weather stations.
It is thought that even though this is only a small random sample of global weather stations, it will give a general idea of global temperature trends.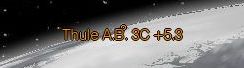
(
Image 2 ) We all have heard that supposedly the glaciers in Greenland are melting, because of global warming. Is that true? Here we see the temperature at Thule Airforce Base in Greenland on the 2. Sept. 2007, it is 3°Celsius. There is a second set of figures, the
climate change indicator: +5.3. 5.3° Celsius was on September 2nd the temperature deviation from the norm. The norm is the "many years average" for September for Thule. As you can see
here, the average September temperature in Thule between the years 1946 and 1990 was -1.8° Celsius.
Then you ask, why does the deviation from the norm not show this: "+4.8"
(as -1.8°Celsius to 3°Celsius equal +4.8°Celsius) ?

(
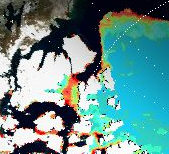
Image 3 )The picture on the left shows the temperature at 11 GMT the day before. It was 4°C and the
climate change indicator shows a deviation which is to be expected:
(as -1.8°Celsius to 4 °Celsius equals +5.8°Celsius).
The reason for the differing values is, that the fluctuating daily temperatures are recorded every hour and the running average is calculated. The running average is then compared to the monthly average, which then is displayed as the
climate change indicator.
Like this we always get a fairly accurate approximation of the change from the monthly average. However, as the
part month averages are compared to the
whole monthly average, it does mean that the climate change values get more accurate towards the end of the month. At the beginning of the month there can be strong fluctuations.
From 1. September to 30. September for instance, we expect a decreasing temperature in the northern hemisphere, which means that the values of the
climate change indicator should decrease until the end of the month. The values will be exactly correct on the 30. September at midnight, for the place indicated. The results before then are neither mathematically nor climatologically quite correct, but it is hoped that they can help to detect temperature trends.

(
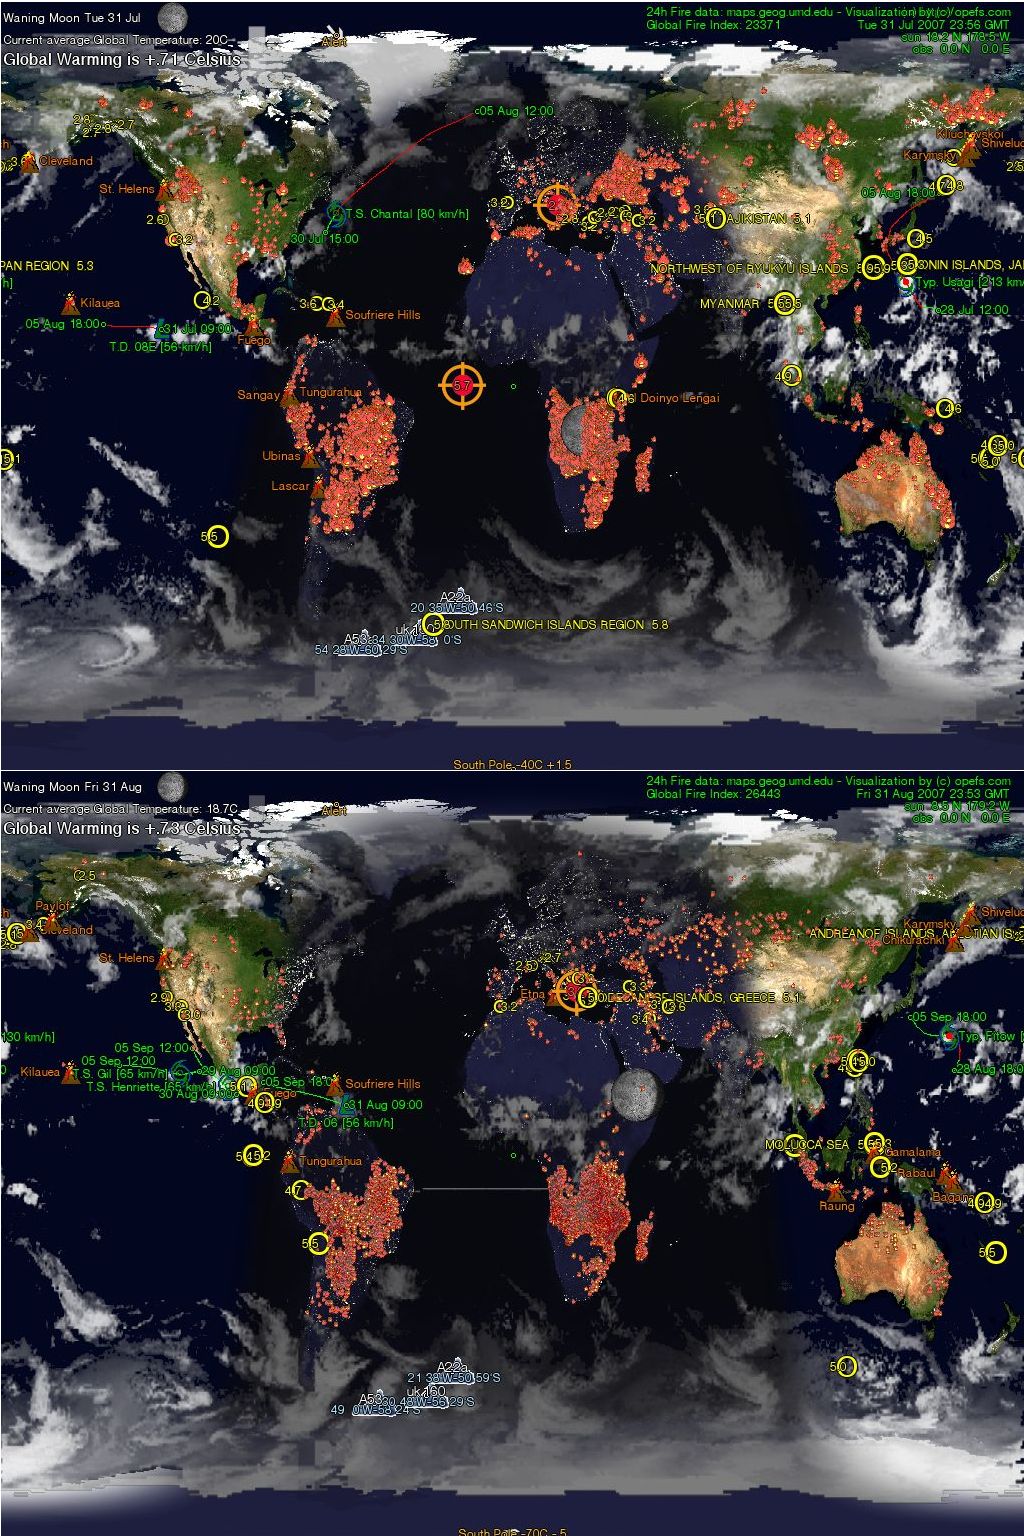
Image 4) There can also be instances when the
climate change indicator shows negative values (global cooling). In any case, when the temperature deviation from the norm is more than 2° Celsius positive or negative, then the fontsize increases and the color changes to indicate hot or cold spots. The hot-/coldspots are highlighted only from the second day of a new month, to have a minimum sample of 24 hours.
Update interval of these data on the webpages: every 60 minutes.

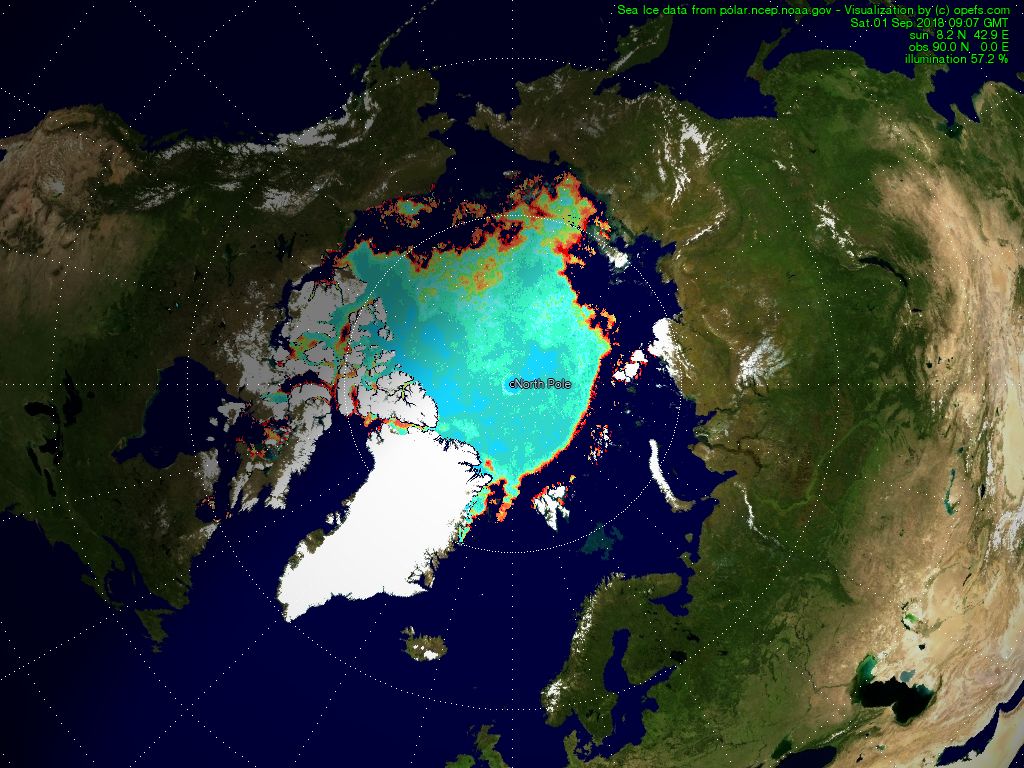
 Whilst these news possible are not featured as prominently in the media, after only a week of being passable, the North West passage is frozen closed again.


