2007-12-26

Color correction

I made a cosmetic change to the display of the maps.
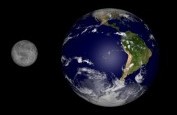
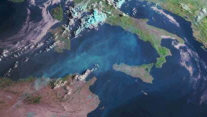
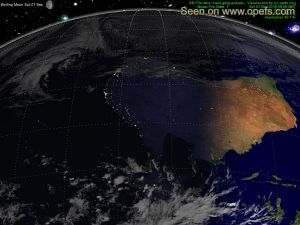
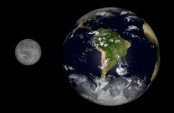
The standard "NASA Blue Marble Next Generation" maps have very dark oceans, as seen on the left.

You may have grown used to the dark, almost black, oceans, but it's not really the way the Earth looks. The new blue shade is shown below the old picture.

Satellite Look Up Tool is repaired
NASA changed the way in which its Spacecraft Master Catalogue is queried. The changes have been incorporated and the relevant pages are fixed.

2007-12-02

Corrected error in the Global Warming index

There was a script error, which calculated the global warming wrong.
The now corrected script shows an above average temperature of +1.78 Celsius at the beginning of December, which is still a lot, but not as roastingly hot as the +11 something Celsius ...

2007-12-01

High temperatures at the beginning of December

The first December shows a Global Warming of 11.46 Celsius. It must be remembered that this means that the average temperature for the whole month of December is 11.46 C above average. The temperature will hopefully progressively fall until the end of December, because the planet is entering the winter season.

Exactly why this should be so, is not entirely clear to me, either. I suspect that there is more landmass in the northern half of the Earth than in the South. Or because there are more weather stations in the north to record the temperature.

2007-10-16

Sea Ice

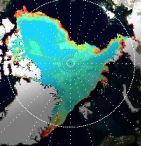
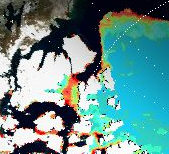
Sea IceLegende der EiskonzentrationThe extent of the Arctic ice field can be observed on the large North Pole map. That map can be opened by clicking on the Polar region.

If polar bear Knut's cousins can still tread safely on ice and in which regions their habitats are threatened by melting pack ice, can be gauged with the help of the color scale.

The origin of the sea ice data is a satellite based passive microwave sensor. The Polar Ice Team of NOAA uses a NASA formula to derive their measurements.
The formula works by comparing the reflective properties of the various types of ice. Strong winds and heavy rains can falsify the data.
According to Russ Page (of the Anchorage WSFO) this happened for instance on 8 January 1997, when heavy 60 knot winds pounded the Bering Sea. In summer, sometimes puddles of water on the ice can lead to underestimating the ice thickness.
Data source : http://polar.ncep.noaa.gov/seaice/

2007-09-23

The North West Passage is shut!

Whilst these news possible are not featured as prominently in the media, after only a week of being passable, the North West passage is frozen closed again.

For fairness I thought I should give these headlines as much space, as the news of its opening. It's still going to be a long time before regular shipping will be able to take a shortcut over the North Pole.

It is still a warning however. The introduction of the "Arctic Screensaver" will make it possible for everyone to keep a close watch on what's happening in the far North, without media bias.

  • Improved Zoomability of Natural Earth Map
    Since a few weeks it's possible to click the Earth Moon image on the start page to zoom to the "Natural Earth Map". Further zooming now takes you straight to the full screen continental maps.

2007-09-16

The North West Passage is open!

At the beginning of the last century many explorers left their lives in the Arctic regions, searching for a way around the Northpole, to find a shorter way to travel to Asia by boat.

The changing climate has now opened this fabled sea route for the first time in human memory. Container ships will be able to get even faster and cheaper from and to the Far East and China.

To keep up with developments in the increasing important developments in the Arctic region i spent today tweaking the Sea Ice image from MMAB Sea Ice Analysis Page for use on my maps.

The full map can be seen here. I've not had time yet to incorporate the map into the site further.

2007-09-10

No current fire data from Modis

There are problems with the Terra and Aqua L0 data feed from MODIS Rapid Response for the Fire data. This means that the fire data displayed on my website are out-of-date!
The last update happened on 7. September, 14:30 GMT.

Naturally, as soon as the proplem is fixed, the data will update again.

2007-09-03

Testing the Climate Change Index

To show that my Climate Change Index is not a completely without value, I give a few examples of its merit:

COMPARISON WITH OFFICIAL CLIMATE CHANGE DATA
"The global average air temperature near the Earth's surface rose 0.74 ± 0.18 °C (1.33 ± 0.32 °F) during the last 100 years." source: http://en.wikipedia.org/wiki/Global_warming

This measurement was arrived at in the report of the IPCC, using error corrected data of tens of thousands of weather stations over 100 years.

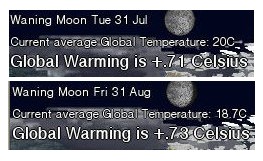
click for close-upFor comparison, here are the latest available full month data from my calculations and sampling of 130 stations. (Older data are archived in DivX movie format and can be downloaded from here: http://stage6.divx.com/Climate-Change).
My results show a temperature rise of +0.71 to +0.73°C.

The difference to the official value of 0.74° Celsius is 1% to 3%, a mean difference of 2%, which I think is amazingly close.

2007-09-02

Climate Change Index

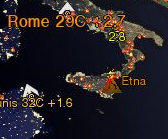
Image 1(Image 1)The display on the left is visible on almost every map of this website. The current average global temperature is calculated from averaging the temperatures of approx. 130 weather stations. The data for this are from http://weather.noaa.gov/.

The Climate Change Index (+1.6° Celsius) is calculated from the deviation of the longterm average temperature of the 130 weather stations. It is thought that even though this is only a small random sample of global weather stations, it will give a general idea of global temperature trends.

Image 2(Image 2 ) We all have heard that supposedly the glaciers in Greenland are melting, because of global warming. Is that true? Here we see the temperature at Thule Airforce Base in Greenland on the 2. Sept. 2007, it is 3°Celsius. There is a second set of figures, the climate change indicator: +5.3. 5.3° Celsius was on September 2nd the temperature deviation from the norm. The norm is the "many years average" for September for Thule. As you can see here, the average September temperature in Thule between the years 1946 and 1990 was -1.8° Celsius.

Then you ask, why does the deviation from the norm not show this: "+4.8"
(as -1.8°Celsius to 3°Celsius equal +4.8°Celsius) ?

Image 3 (Image 3 )The picture on the left shows the temperature at 11 GMT the day before. It was 4°C and the climate change indicator shows a deviation which is to be expected:
(as -1.8°Celsius to 4 °Celsius equals +5.8°Celsius).


The reason for the differing values is, that the fluctuating daily temperatures are recorded every hour and the running average is calculated. The running average is then compared to the monthly average, which then is displayed as the climate change indicator.

Like this we always get a fairly accurate approximation of the change from the monthly average. However, as the part month averages are compared to the whole monthly average, it does mean that the climate change values get more accurate towards the end of the month. At the beginning of the month there can be strong fluctuations.

From 1. September to 30. September for instance, we expect a decreasing temperature in the northern hemisphere, which means that the values of the climate change indicator should decrease until the end of the month. The values will be exactly correct on the 30. September at midnight, for the place indicated. The results before then are neither mathematically nor climatologically quite correct, but it is hoped that they can help to detect temperature trends.

Image 4 (Image 4) There can also be instances when the climate change indicator shows negative values (global cooling). In any case, when the temperature deviation from the norm is more than 2° Celsius positive or negative, then the fontsize increases and the color changes to indicate hot or cold spots. The hot-/coldspots are highlighted only from the second day of a new month, to have a minimum sample of 24 hours.

Update interval of these data on the webpages: every 60 minutes.
2007-08-30

Italian fires show no sign of abating

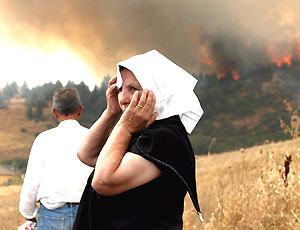
In this Meteosat image from the 30. August 2007 thick smoke can still be seen drifting southwesterly from the fires along the Italian Campania.

After a long fight, the fires in Italy are still not under control. Yesterday the fires entered the Park of the Villa Ada in Rome, the nature preserve Park Veio and they continue to burn wild in many parts of the South.


In this MODIS image the various fires covering Italy are shown as red dots.

2007-08-29

Live Lightning data for Europe

Without further ado I've added live lightning data for Europe. This would not have been possible without the help of the European Blitzortungs community. On their website you find more detailed information, cool Yahoo gadgets to warn you of nearing thunderstorms and KML files to load into your Google Earth, for near real-time lightning data (utilities).

The lightning data can not be used for the protection of life or property. It is only useable for entertainment...

2007-08-26

Automated displays of unusual temperature

The temperatures display has been slightly altered. I'm not sure if I'm going to leave it like this:
when the temperature at a place is above 2° Celsius of the monthly average, then the place mark is highlighted with a larger font, and a more reddish color.

If the temperature is below 2° Celsius of the monthly average, then the place mark is also highlighted with a larger font, but has a blueish color.

The figure of 2° Celsius is maybe arbitrary, but a difference of 2°C from the monthly average can mean a lot. As it happens, there are almost no significant deviations from the average temperature in the US, South-America, Australia or Africa this month. Eastern and Northern Europe (incl. Greenland) and Mogolia are showing extremely high temperatures. As is Japan.

New screensaver of Arabian Peninsula


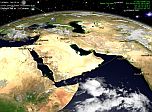
A Screensaver with a start view of the Arabian Peninsula is now online. Includes Active Desktop wallpaper on this page.

Upside down map of Australia

Upside down map of AustraliaA few years ago someone requested an upside-down map of Australia. The view is now available as free screen saver and active desktop wallpaper. Below the equator everything is upside down!

North is South, and South is North.

2007-08-24

European fires burn deadly trail in south

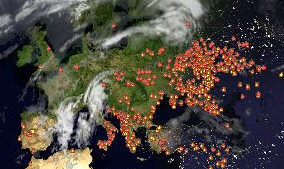
European FiresToday the news were filled with horror stories of gruesome fires in Europe. So have on the Greek island of Pellopone 15 people killed, and in Sicily, were someone keeps setting fire to the trees near the coastline, so that they can do property development there, 11 people have been killed altogether.

What I wonder about, were are the fires that are not in the news: aren't there any? The first image here is Europe, and you'll be able to find Italy and Greece. See how tiny those fires are against the fires in the Ukraine? There must be a lot of property development going on. After all, they need to play catch-up.

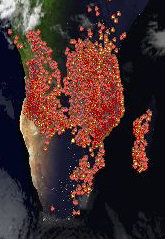
Fires in the rain forestNow lets compare this with the fires in the rain forest, or the small fires in Africa, which are not mentioned.

If those fires in the tourist spots of Europe are terrible, how much worse must it be for those people in Brazil or Africa? My computer is counting now record numbers of active fires, at one stage approaching 30,000.

It can't be good for the climate either. Think of the millions of tons of CO² and sulphuric acid, etc. released into the atmosphere. I read someplace that a certain level of forest fires is essential for the survival of the forest. But how much is too much, and how much is necessary?

Fires in the AfricaIf forests globally are more or less similar, being composed of trees, and leaves and forest stuff, then it is not understandable how forests in Europe or the USA can survive so well. Because we burn our forests only very seldom, as you can see on those maps... Earth Fire Map (updated every 3 hours).
(All shown images are from today).

Rainforest loss shocks Brazil 2005
Will Amazon drought worsen in '2007? ( from May '07)
A rainforest in danger (Congo 2007)

2007-08-22

############## Mailing list update #############
New change blog is online and linked in

The website and all other bits (screen savers, desktops) has been updated, to link to this new blog. The old blog was a blog only by name, whereas this one here has really all the advantages of a real blog, especially a way for my visitors to leave feedback.

More remarks on global fires and the fire display
I will be reducing the size of the fire icons so that it doesn't quite look like whole continents are totally ablaze. Instead I'll try to adjust the icon colours, to show different fire temperatures. I don't think it will make much difference.

I have calculated that with about 20,000 fires worldwide, each being larger than 50m²,
an area of at least 1x1 kilometers (1 km²) is burning. That doesn't sound that bad at first. After all, we are talking about a whole world here, and not Tom's garden.

However, that 1x1 kilometer square is burning constantly. You know from a fire that it doesn't stay in one place, but that it feeds on the vegetation and moves constantly. It is difficult to imagine a 1 by 1 kilometer large flame, which permanently needs new fuel to keep burning. The attrition rate of the global fires must be awesome. I will be asking UMD how much area of forest a typical fire consumes in a day.
A note on the restored fire data feed
The "Fire Information for Resource Management System", for short FIRMS, from the University of Michigan is the source of my fire data. On the website of FIRMS everyone can double check my visualization results against the results of the experts:
http://maps.geog.umd.edu/firms/maps.asp. They even have a KML feed, so that you can watch the fires in Google Earth.

Server upgrade
To keep up with the increased workload on the server, which can be caused a large number of fires, the RAM capacity has been doubled, to 1Gigabyte.

Donations
Another one of my servers is rented and costs approx. 100 Dollar monthly. If someone wishes to help me financially towards this and other expenses (electricity, RAM, etc):
Donations

Invitation for Venture Capital or Job offers
The operation of websites is not my full time job.
In my day job I work as a doorman/phone operator/receptionist/clerk.

Therefore either venture capital to develop this website on a full-time basis, possibly as part of an environmental group or organization, or other job offers would be welcome. I am a self-taught generalist in the computer world who programs in Basic, and gets the job done with it.

RSS feed of the Climate Change Channel
Subscribe to the "Climate Change Channel" RSS feed here
: Subscribe to the Climate Change Channel
Features (written) commentary, exclusive CGI animation of weather, nature and climate related issues.


Tuesday, 21. August 2007
Hurricane Dean
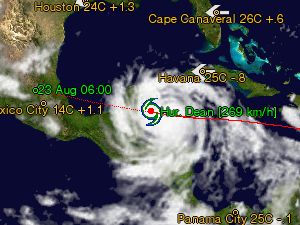
Hurricane Dean category 5
Dean weakens again after having been a major storm of category 5 on the Saffir-Simpson hurricane scale, with windspeeds exceeding 269km/h, 167mph. It has hit the small town of Majahual in Mexico, which is in a sparsely populated area. Hurricane Dean swept earlier this week over Jamaica and the Caymans, causing greatest havoc and about 10 deaths.

Fires are coming back, or optionally, not
After being offline for two days, the fire data are streaming in again. If you would like a Whole Earth screensaver or background without fire display on a permanent basis, then check out the download sections for the screensavers or active desktops. There are fire-free versions to download.

Asia and Distant Earth desktops
A coding error which prevented the downloading of these backgrounds has been corrected.

Climate Change Channel
Longterm observervations from this site are now on the stage6 Climate Change Channel:
Climate Change Channel
Click the banner to visit there.

New Free WideScreen Savers available
It appears I forgot to mention on this page that there are now screensavers available for screens with 16:9 aspect ratios, and with resolutions of over 1024x768 pixels! Visit this page for the new free screensavers.

Sunday, 19. August 2007
Latest news: no fires now
Now, it wasn't that long ago, that I complained about the large number of fires. That complaint is superflous now, as there are almost no fires shown anywhere. The cause is presumably an error with the satellite feed, which is beyond my control. I apologize anyways.

Saturday, 18. August 2007
"Huge" DivX Movies now online
Stage 6Since about 6 months I'm sitting on large webcam movies, 50 - 130mb in size. How to distribute them online in high quality (1024x768px), without incurring huge bandwidth costs?

The solution is the online DivX community "Stage 6". To watch the animations, please download first the latest DivX webplayer from the DivX site: DivX Web Player 1.4.0 Beta 2.

Then visit my video page on Stage 6: http://stage6.divx.com/Climate-Change/videos/
A couple of animations is now online, each about 5 minutes in length. The movies will stream with a DSL connection, so you don't need to wait for the download, and you can watch them in a browser window on Windows or Mac (or download them to your harddrive).

Wednesday, 15. August 2007
There is a problem with the huge number of fires
The number of global fires is now over 26.000. My server is having problems with this, because the position of each fire must be computed, to be displayed at the correct place. This is not so bad as the problems, which our Earth is experiencing, because of this. But you may experience delays in the update of the maps from my site. As a race we will feel the effects of these fires a little bit later, of course. It is only the question if the global dimming from the smoke will balance the effects of the global warming, from the release of carbon dioxide through the fires???

Quake Alerts fixed
They work now as they should.

16. July 2007
Quake Alerts still malfunctioned
The heavy quake in Japan today gave me a chance to rework the still malfunctioning "Quake-Alerts". I don't know, how the spelling error crept into the script. But it has been fixed, and I will hope that we don't need the quake alerts again for some time. Latest figures spoke of six fatalities in Japan, caused by the quakes.

14. June 2007
Quake Alerts malfunction
Thankfully there aren't too many earthquakes of strength 6 or above. That is the treshold for spoken quake alerts, normally. But a bug prevented this at the recent Guatemala quake from working. I've reworked the program code, and hopefully the quake alerts will be working again, at the next heavy quake.

12. June 2007
High Res Cloud cover over Asai and Australia restored
Over the weekend, until today, no high-res clouds were available for the mentioned region. Instead I switched to a low-res backup service, to provide at least some cloud coverage.

Fire Display changed back to the old method (24 hour fires)
There was a problem with the FTP server, which has now been fixed. Because I now have access to the raw fire data again I prefer to return to the old display format. I suppose it was better to have some fire display, than none at all. Also it is handy to have a backup script, and an alternative method to retrieve data, ready to go.

click here for older posts